Tis’ the season for the Santa Claus Rally! This unique seasonal pattern was first discovered by Yale Hirsch in 1972. Hirsch, creator of the Stock Trader’s Almanac, defined the period as the last five trading days of the year plus the first two trading days of the new year.
The Santa Claus Rally usually generates headlines across financial media due to the historically strong market returns during this relatively short timeframe. As shown in the chart below, the S&P 500 has generated average returns of 1.3% during the Santa Claus Rally period, compared to only a 0.2% average return for all rolling seven-day returns. It refers to the sustained upswing in the stock market typically observed around the Christmas holiday on December 25. Most analysts suggest that these rallies occur in the week leading up to Christmas, while others note trends extending from Christmas Day through January.
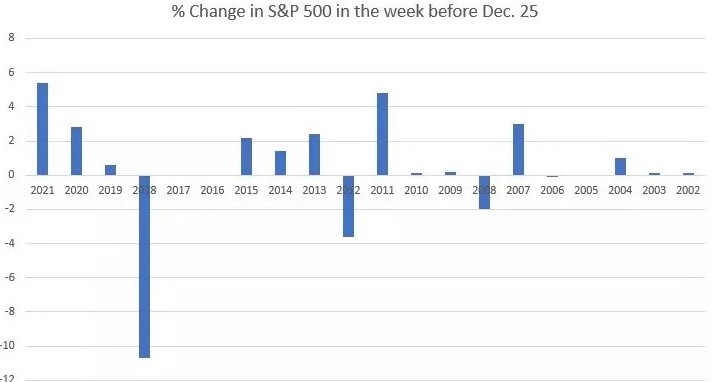
Analyzing December performance over 20 years, the evidence of a Santa Claus rally in the week leading up to December 25 is minimal. Positive returns occurred in 13 weeks, negative returns in five, and two weeks saw no change. The range varied from +5.4% in 2021 to -10.7% in 2018. While Santa Claus reliably delivers presents on Christmas, the stock market’s gift-giving is less predictable. Any positive gain around Christmas is commonly referred to as the Santa Claus rally.
In January, according to Yale Hirsch, the first two trading days are considered part of the rally. Investors may buy stocks in anticipation of a rise in stock prices during January, known as the January Effect. Some research indicates that value stocks outperform growth stocks in December.
For traders, the Santa Claus rally is a point of observation, with attention to cyclical trends and historical patterns. Trading during this period involves monitoring risk and reward through position-sizing and stop orders. However, for long-term investors and those saving for retirement, the Santa Claus rally has limited impact over the long term. It is a headline event on the periphery rather than a reason to shift bullish or bearish sentiments (Seasonality in Stock and Bond ETFs (2001—2014): The Months Are Getting Mixed Up but Santa Delivers on Time, Academia, 2015).
The causes of a Santa Claus rally are varied, including investor optimism driven by the holiday spirit, increased holiday shopping, and the investing of holiday bonuses. Another theory suggests that institutional investors going on vacation during this period leave the market to retail investors, who tend to be more bullish.
One of the other primary aspects of the Santa Claus Rally is its application as an indicator for future market returns. As Yale Hirsch stated, “If Santa Claus should fail to call, bears may come to Broad and Wall.” Historical returns, as shown below, give merit to his maxim, as the S&P 500 historically underperforms in January and over the following year when Santa no-shows and doesn’t deliver investors a year-end rally.
IMPORTANT DISCLOSURES
This material is for general information only and is not intended to provide specific advice or recommendations for any individual. There is no assurance that the views or strategies discussed are suitable for all investors. To determine which investment(s) may be appropriate for you, please consult your financial professional prior to investing.
Investing involves risks including possible loss of principal. No investment strategy or risk management technique can guarantee return or eliminate risk in all market environments. For more information on the risks associated with the strategies and product types discussed please visit https://lplresearch.com/Risks
References to markets, asset classes, and sectors are generally regarding the corresponding market index. Indexes are unmanaged statistical composites and cannot be invested into directly. Index performance is not indicative of the performance of any investment and do not reflect fees, expenses, or sales charges. All performance referenced is historical and is no guarantee of future results.
Unless otherwise stated LPL Financial and the third party persons and firms mentioned are not affiliates of each other and make no representation with respect to each other. Any company names noted herein are for educational purposes only and not an indication of trading intent or a solicitation of their products or services.
All information is believed to be from reliable sources; however, LPL Financial makes no representation as to its completeness or accuracy.
Securities and advisory services offered through LPL Financial, a registered investment advisor and broker-dealer. Member FINRA/SIPC.
Tracking # 1-05352565