It’s a bull market for pessimism right now. We know the list of concerns is long and includes an aggressive Federal Reserve with a spotty (and that’s putting it kindly) track record of navigating a soft landing, stagflation, ongoing China lockdowns, disrupted supply chains, overly optimistic earnings estimates, the ongoing Russia-Ukraine war, and the latest- failing crypto firms.
“We fully understand the bear case right now and acknowledge optimists are scarce, but based on the market’s track record after sharp downdrafts and favorable seasonal forces in July, we think now may be a good time for those with some dry powder to nibble at this market.” – LPL Financial Equity Strategist Jeffrey Buchbinder
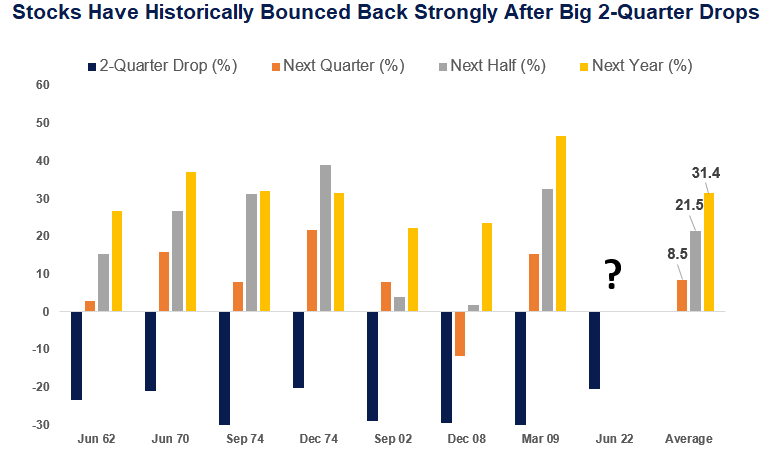
Source: Bespoke Investment Group 07/01/22 (1946 – current). All indexes are unmanaged and cannot be invested into directly. Past performance is no guarantee of future results. The modern design of the S&P 500 index was first launched in 1957. Performance before then incorporates the performance of its predecessor index, the S&P 90.
The LPL Research Strategic and Tactical Asset Allocation Committee did just that in July, raising its equity allocation by 3 percentage points to 65%, compared with a benchmark of 60%.
So why now? First, as shown in the LPL Chart of the Day, stocks have historically bounced back strongly from big 2-quarter drops as we just experienced. In fact, after a more than 20% drop over 2 quarters (the S&P 500 Index fell 20.6% in the first half of 2022), the average gain the next 2 quarters has been 21.5%. The average performance over the following year has been 31.4%, which is consistent with the average gain off of a midterm election year low (32%). That low may have been put in place last month, though we’ll have to wait to see for sure.
While of course, we can’t predict that historical pattern will repeat, it certainly helps reassure those who have stuck with this market that better days for stocks may be on the way. Another reason to be encouraged that stocks may soon be poised for a rebound is that in recent years, July has tended to be a good month for stocks. Over the last decade, the S&P 500 has gained an average of 2.5% in July, behind only April and November—and only marginally—as the best months over this time period. Going back further, since 1950 only April, November, and December have been better months for stocks, as noted in the chart below.
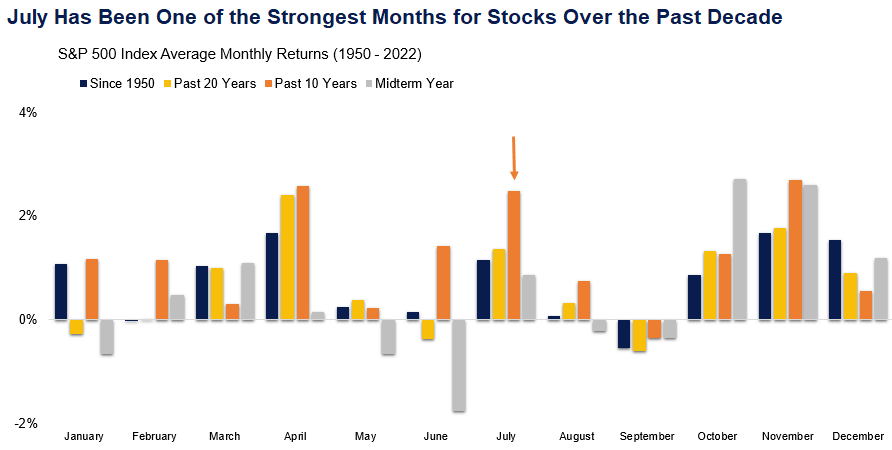
Source: Factset 7/1/22 (1950 – current)
The next round of inflation data, the start of a much-anticipated third-quarter earnings season, and what we hear from the Fed at the end of this month will go a long way toward determining whether July follows this pattern of stock market gains. Regardless, we like the chances. Don’t forget, shallow bear markets as we’ve had so far have tended to bottom in about 7 months on average! As we approach month seven in July, history seems to be on the bull’s side.