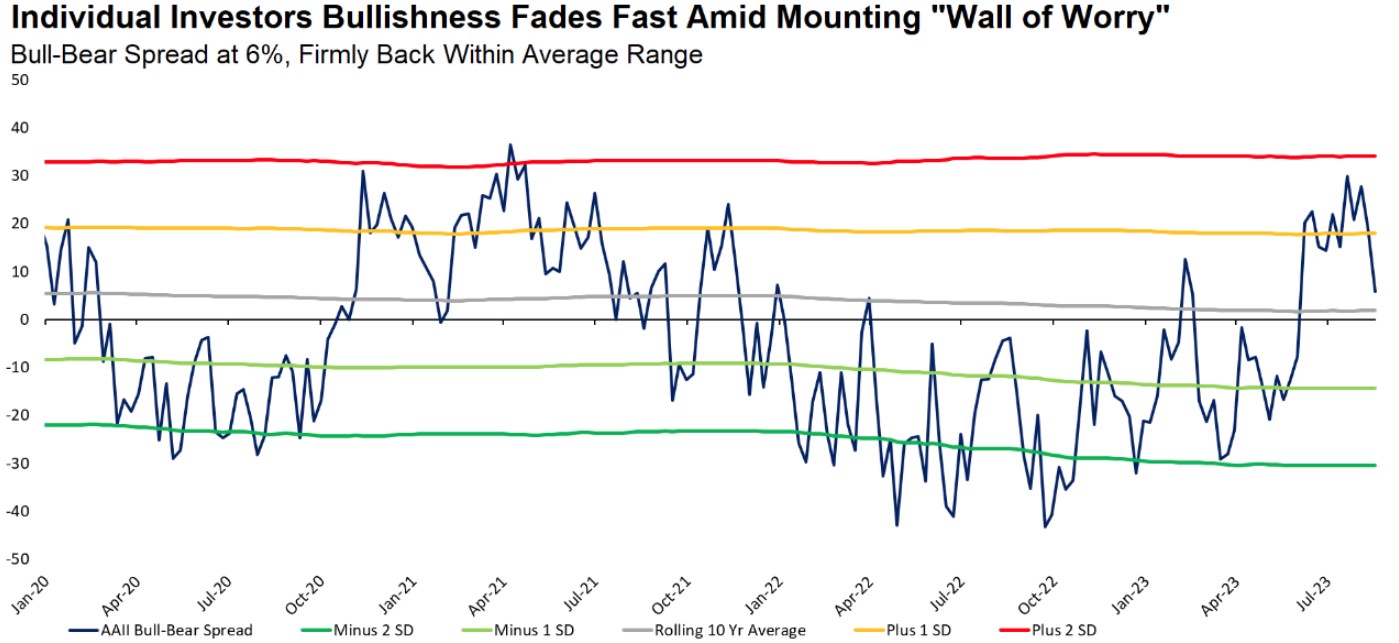
The latest weekly data from the American Association of Individual Investors (AAII) showed that individual investor sentiment plummeted over the last week from fairly bullish to pretty neutral as the market and economic environment so far in August caused bulls to disappear and bears to come out of hibernation. This is perhaps not surprising as individual investors, who have been bullish overall since the start of June—the longest period since the summer of 2021—are worried about a stock market correction (the S&P 500 is down 4% in August), rising interest rates, the Fitch downgrade of U.S. debt, China weakness, and a potential reacceleration in inflation.
The percentage of individual investors who are bullish about short-term market expectations is 36%, down from 45% last week but still just above the long-term (10-year rolling) average of 34%, while the percentage of investors who are bearish rose to 5% to 30%, compared to the long-term average of 32%. This puts the statistic that we normally pay attention to, the spread between the bulls and the bears, at 6%, so still slightly bullish versus a long-term average of 2%, but a steep decline from 19% last week, and 28% the week prior.
As shown in chart the below, investor sentiment, as measured by the spread between bulls and bears in the AAII data, moved decisively closer to its long-term average, having been elevated more than one standard deviation above that, and into very bullish territory, for the last month. The weekly decline in the bull-bear spread of over 13% represents the second largest weekly decline this year.

Source: LPL Research, AAII, Bloomberg, 8/17/23. All indexes are unmanaged and cannot be invested into directly. Past performance is no guarantee of future results.
We generally look at investor sentiment from a contrarian perspective, so the fact that this indicator is still marginally bullish is not supportive of stock prices (although it is getting more supportive as the bullishness fades). Historically, when the bull-bear spread has been around average the forward S&P 500 returns have also been right around average. We wouldn’t expect this measure of sentiment to be supportive of stocks unless it reaches a bearish extreme of greater than one standard deviation below the long-term average (below -14%, where it was until May of this year before we saw the run up in the S&P 500 in June and July).

Another gauge of investor sentiment we follow is also showing waning (but still slightly bullish) investor confidence. Bulls in the Investors Intelligence survey fell to 47% for the week ending August 15, down 10% from two weeks ago. Bears have been rather steady in that survey at around 19%. The bull-bear spread in this survey is now at +27%, down from +38% two weeks ago (which was a two-year high). The CNN Fear & Greed Index (which is a composite of seven market-based indicators) is in the neutral zone at 52 (out of 100), compared to a “Greed” score of 62 a week ago and “Extreme Greed” (80) a month ago.
The Bottom Line
The number of risks facing markets and the economy have started to dent investor confidence. As the stock market became more stretched in June and July, investor confidence approached extremely bullish levels. The recent cooling has left sentiment neutral for stocks, but should the “wall of worry” scare off more bulls, sentiment may become a catalyst for stocks once more from a contrarian perspective.
We maintain a neutral allocation to equities and are overweight fixed income (as valuations have become increasingly attractive relative to equities amid higher yields), funded from underweight to cash which faces heightened reinvestment risk.
IMPORTANT DISCLOSURES:
This material is for general information only and is not intended to provide specific advice or recommendations for any individual. There is no assurance that the views or strategies discussed are suitable for all investors or will yield positive outcomes. Investing involves risks including possible loss of principal. Any economic forecasts set forth may not develop as predicted and are subject to change.


